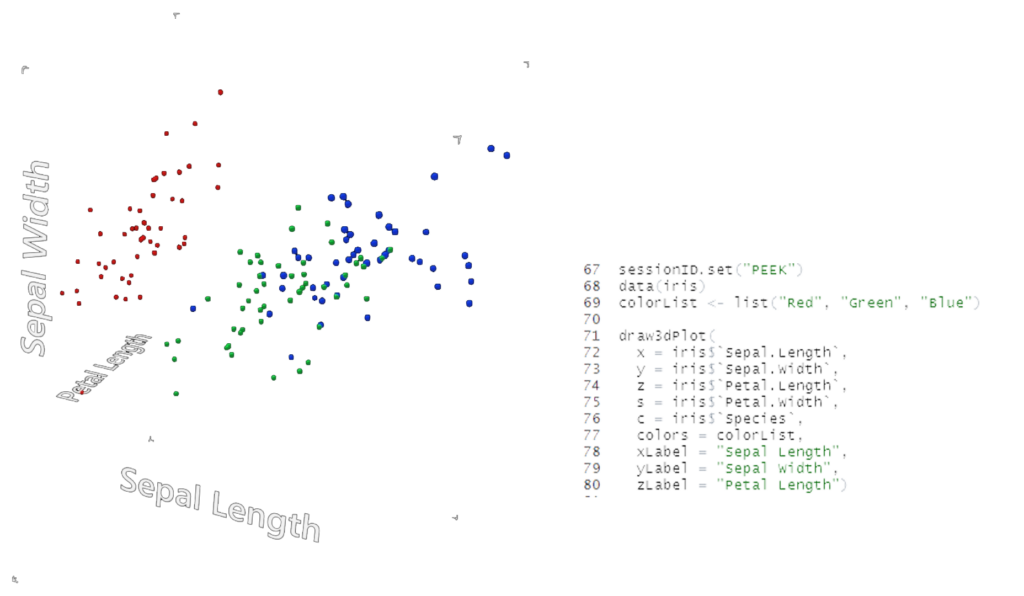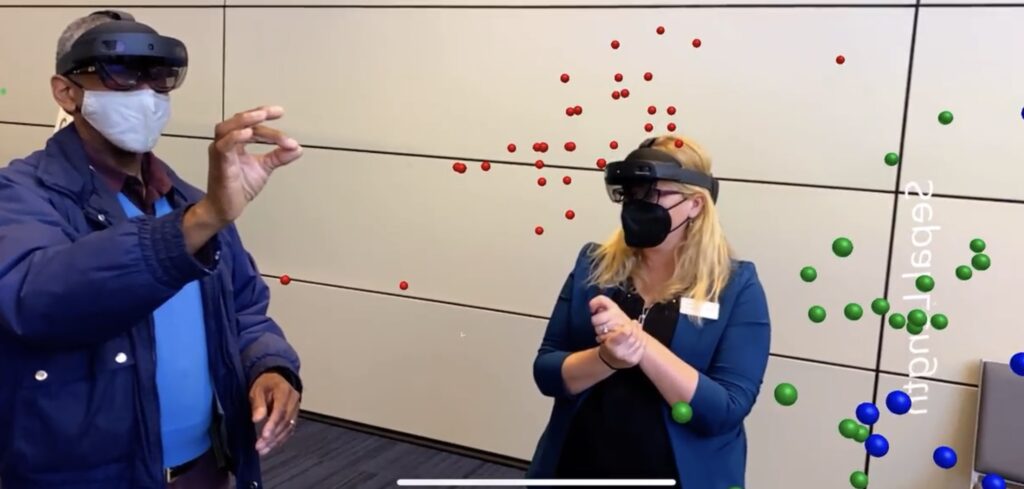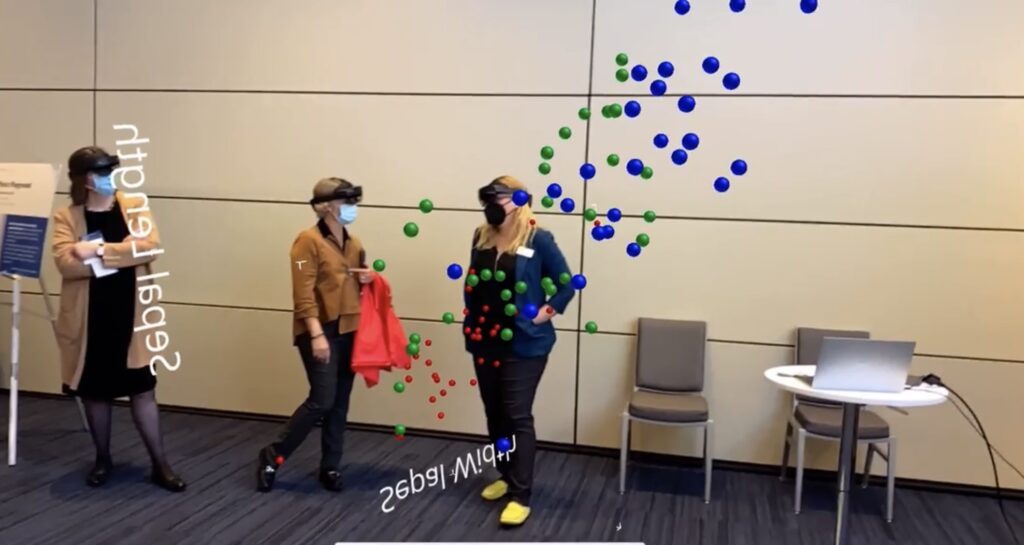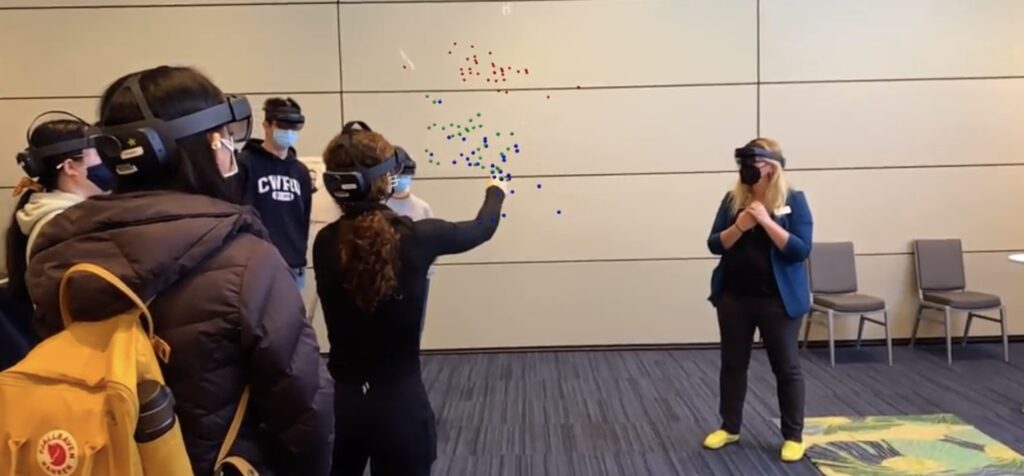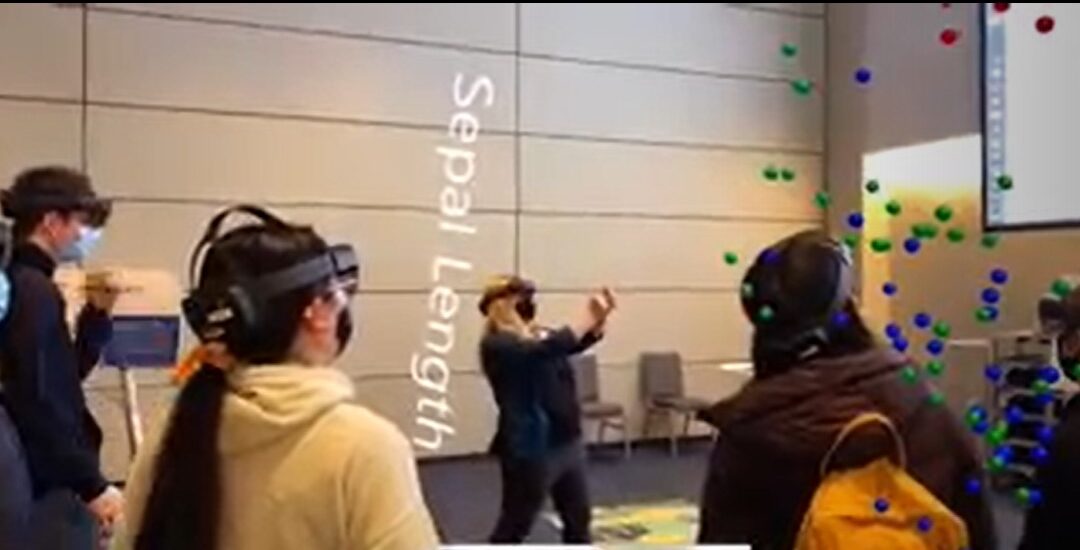
In Dr. Bruckman's course, Data Visualization and Analytics, students learn about the various ways to visually represent data effectively. Students are typically presented with a dataset and are taught to code it into a visual format, making choices along the way as to how that data should be shown to best suit an argument. But up until this point, she was limited to 2D options representations.
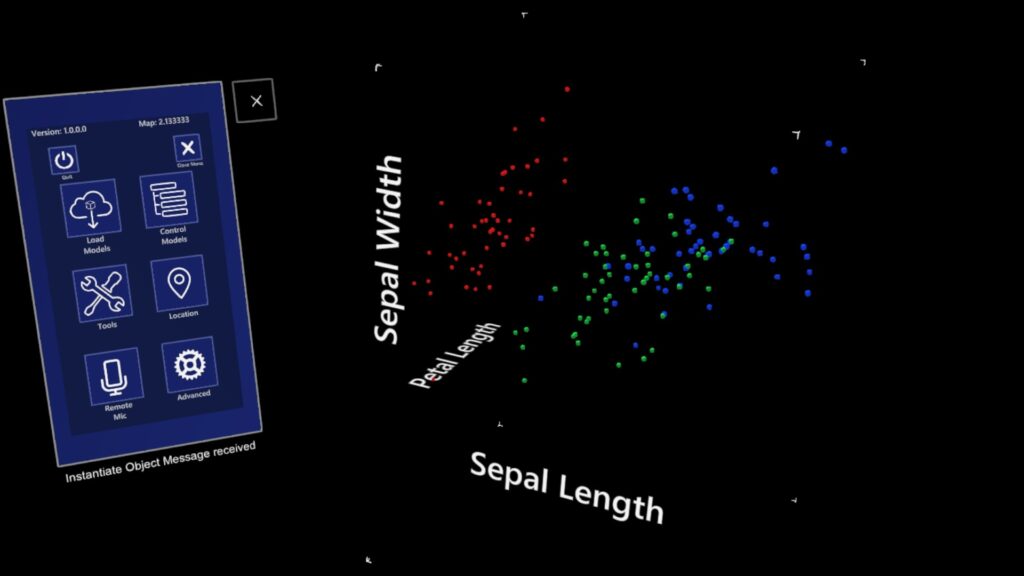
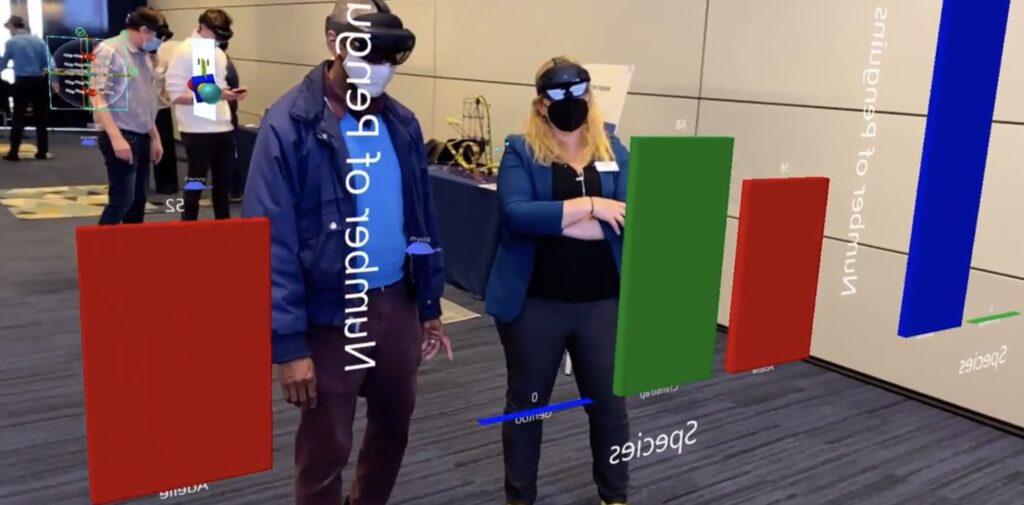
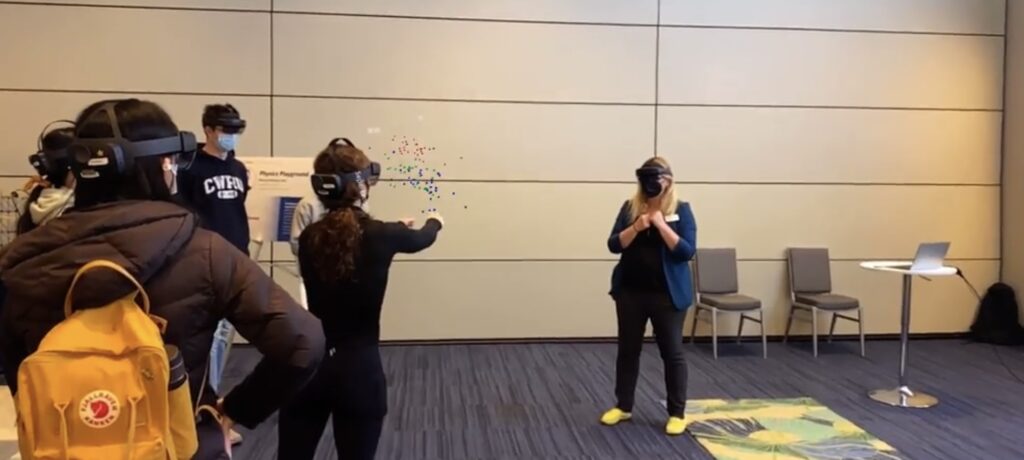
In the app developed by Dr. Bruckman during her fellowship (3-D DataViz), students have the ability to present data holographically in 3D from their familiar coding platform, which can be edited live and immediately pushed to all connected lenses. Dr Bruckman hopes that this additional dimension of representation can improve their ability to analyze and communicate through data.


