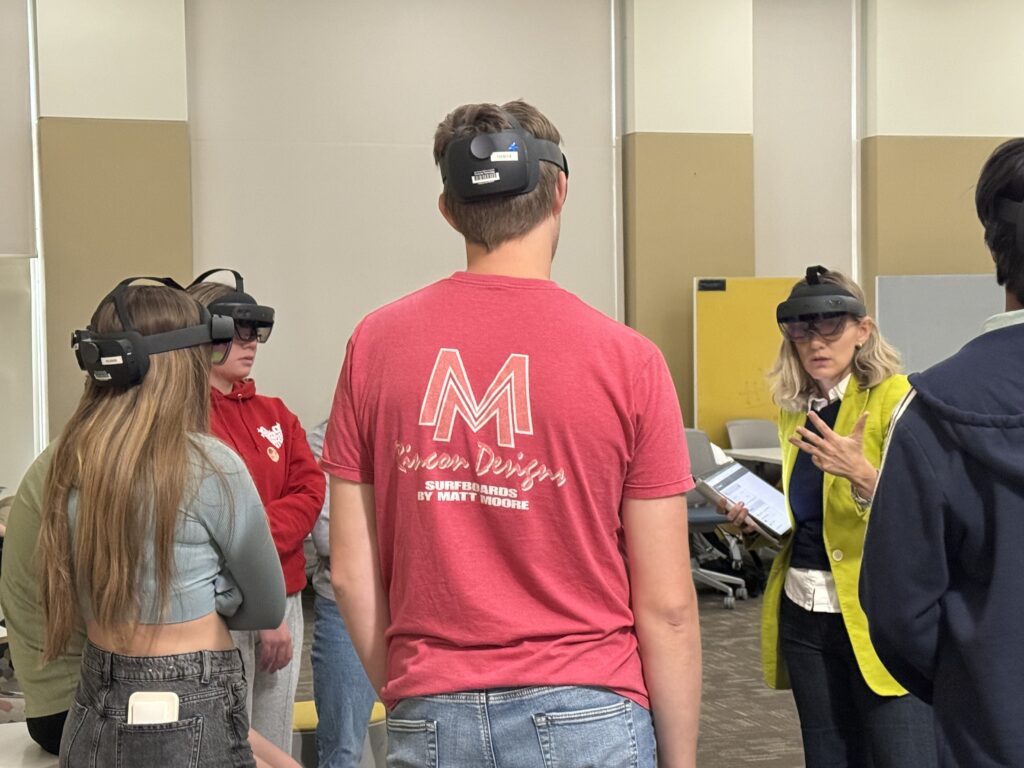
Dr. Jenny Hawkins teaches an intro-level economics course to hundreds of undergraduates each year and one of the first things they cover is supply and demand and the various factors that affect them. In our globalized and interconnected economy, however, the theories can run contrary to intuition, which can leave students feeling insecure when asked to apply their understanding to real news and real markets.
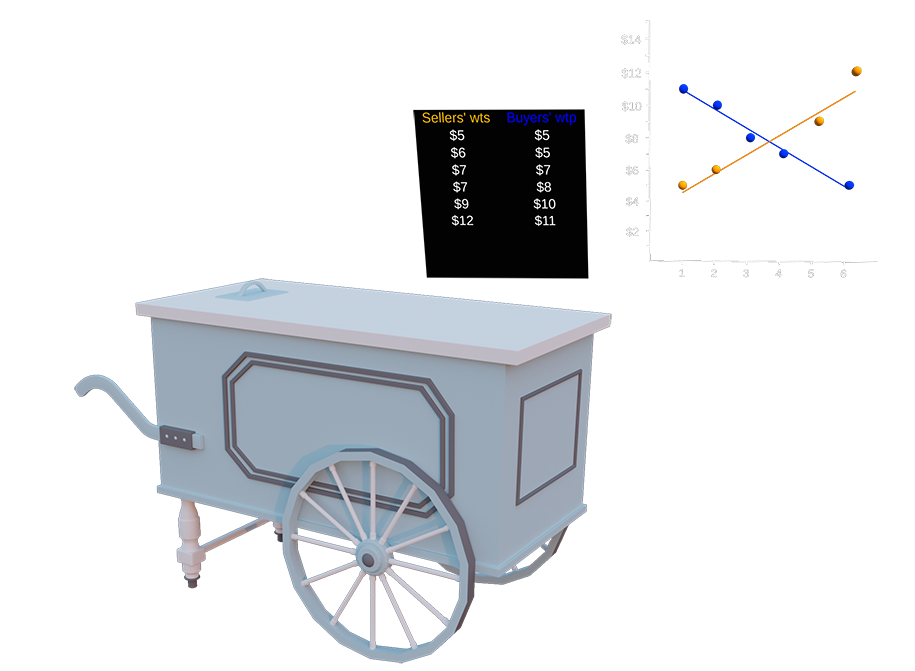
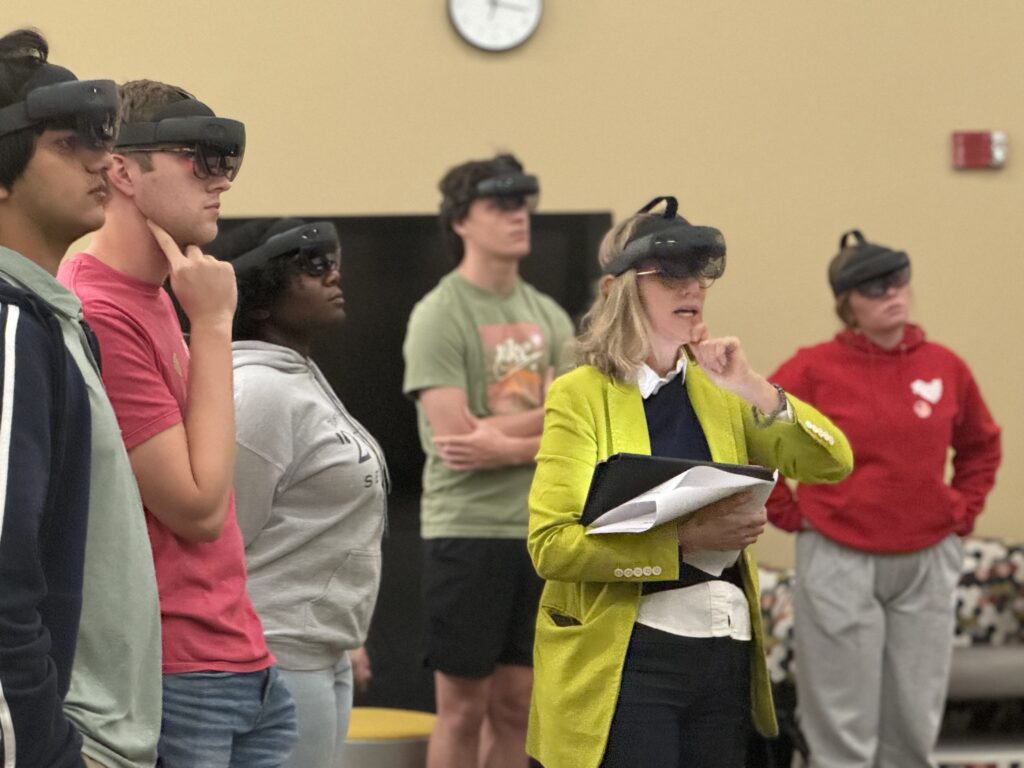
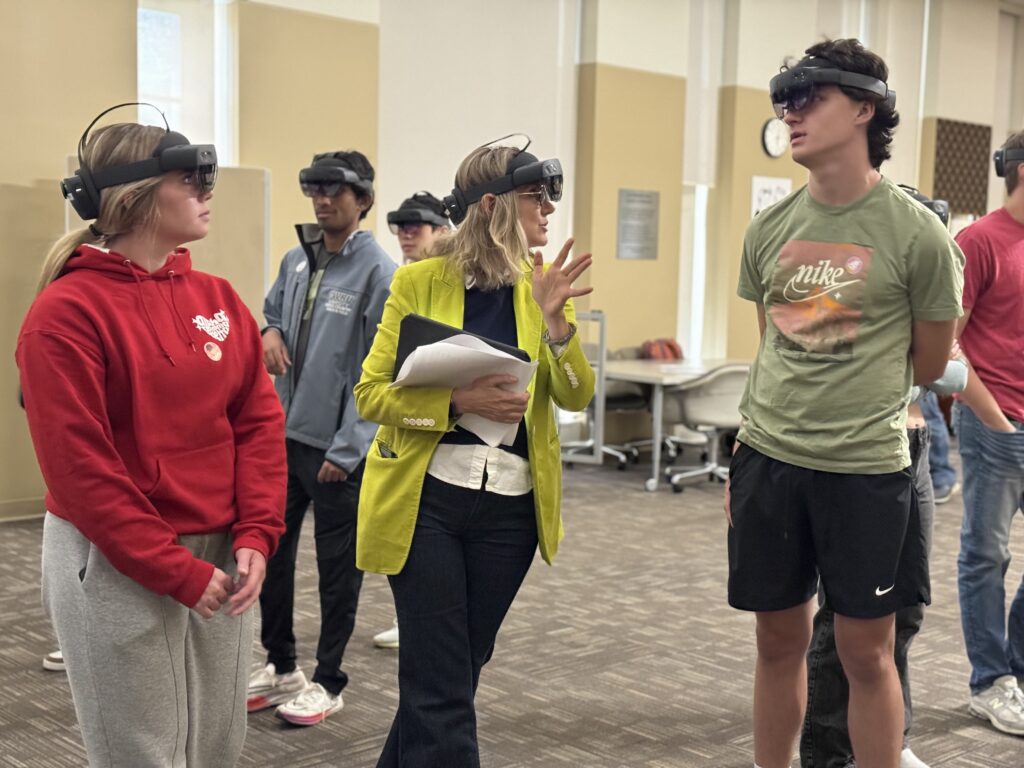
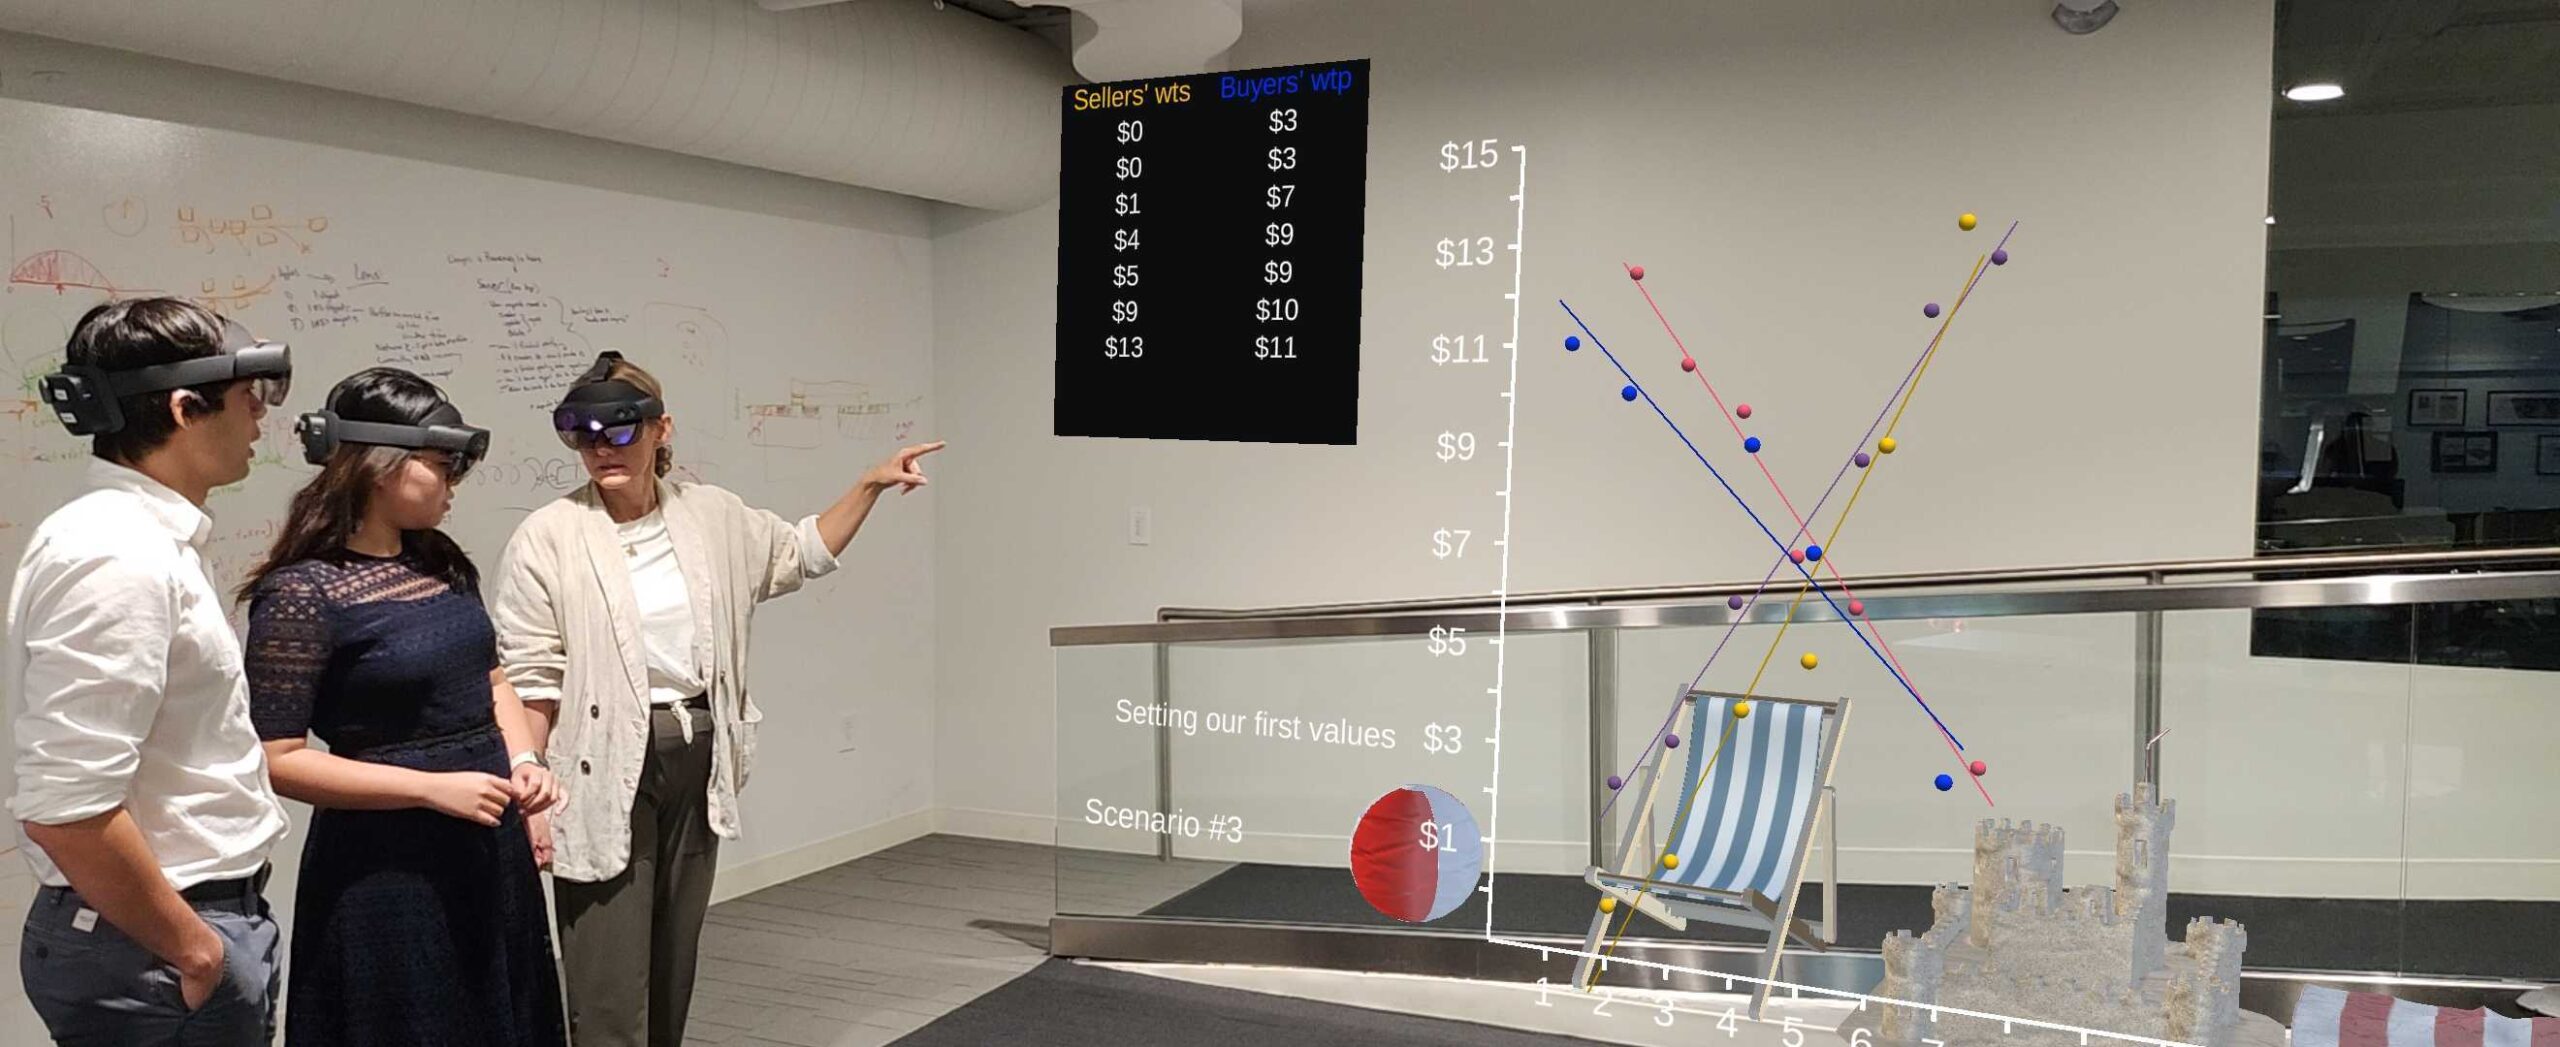
Dr. Hawkins often uses stories to teach the theories but was eager for a way to put students wholly into situations where they would be required to apply their understanding and thus improve their confidence to assess and predict changes. In the app created during her fellowship year, (econXplore), students arrive into a holographic setting where a microcosm market becomes established (e.g., a beach with popsicle carts.) Users are assigned an identity as a buyer or seller and are asked to pinpoint their prices (i.e., their willingness to buy or sell a popsicle.) An enormous graph then appears on the wall that tabulates all the individual responses and identifies the market price as the point of intersection of these two slopes. News headlines then appear, for example, “Flooding destroys local berry crop,” and users are asked to change their price accordingly. The graph updates and the group discusses how that scenario did and should have affected their prices. Dr. Hawkins can then toggle between the scenarios to guide the discussion and drive home the theories underpinning these shifts.


